
Over recent years the topic of how GB generates and imports energy seems to be one of growing public interest. It's also an area where real time data is available, and therefore as 2024 draws to a close, we can immediately look back on the trends for the year.
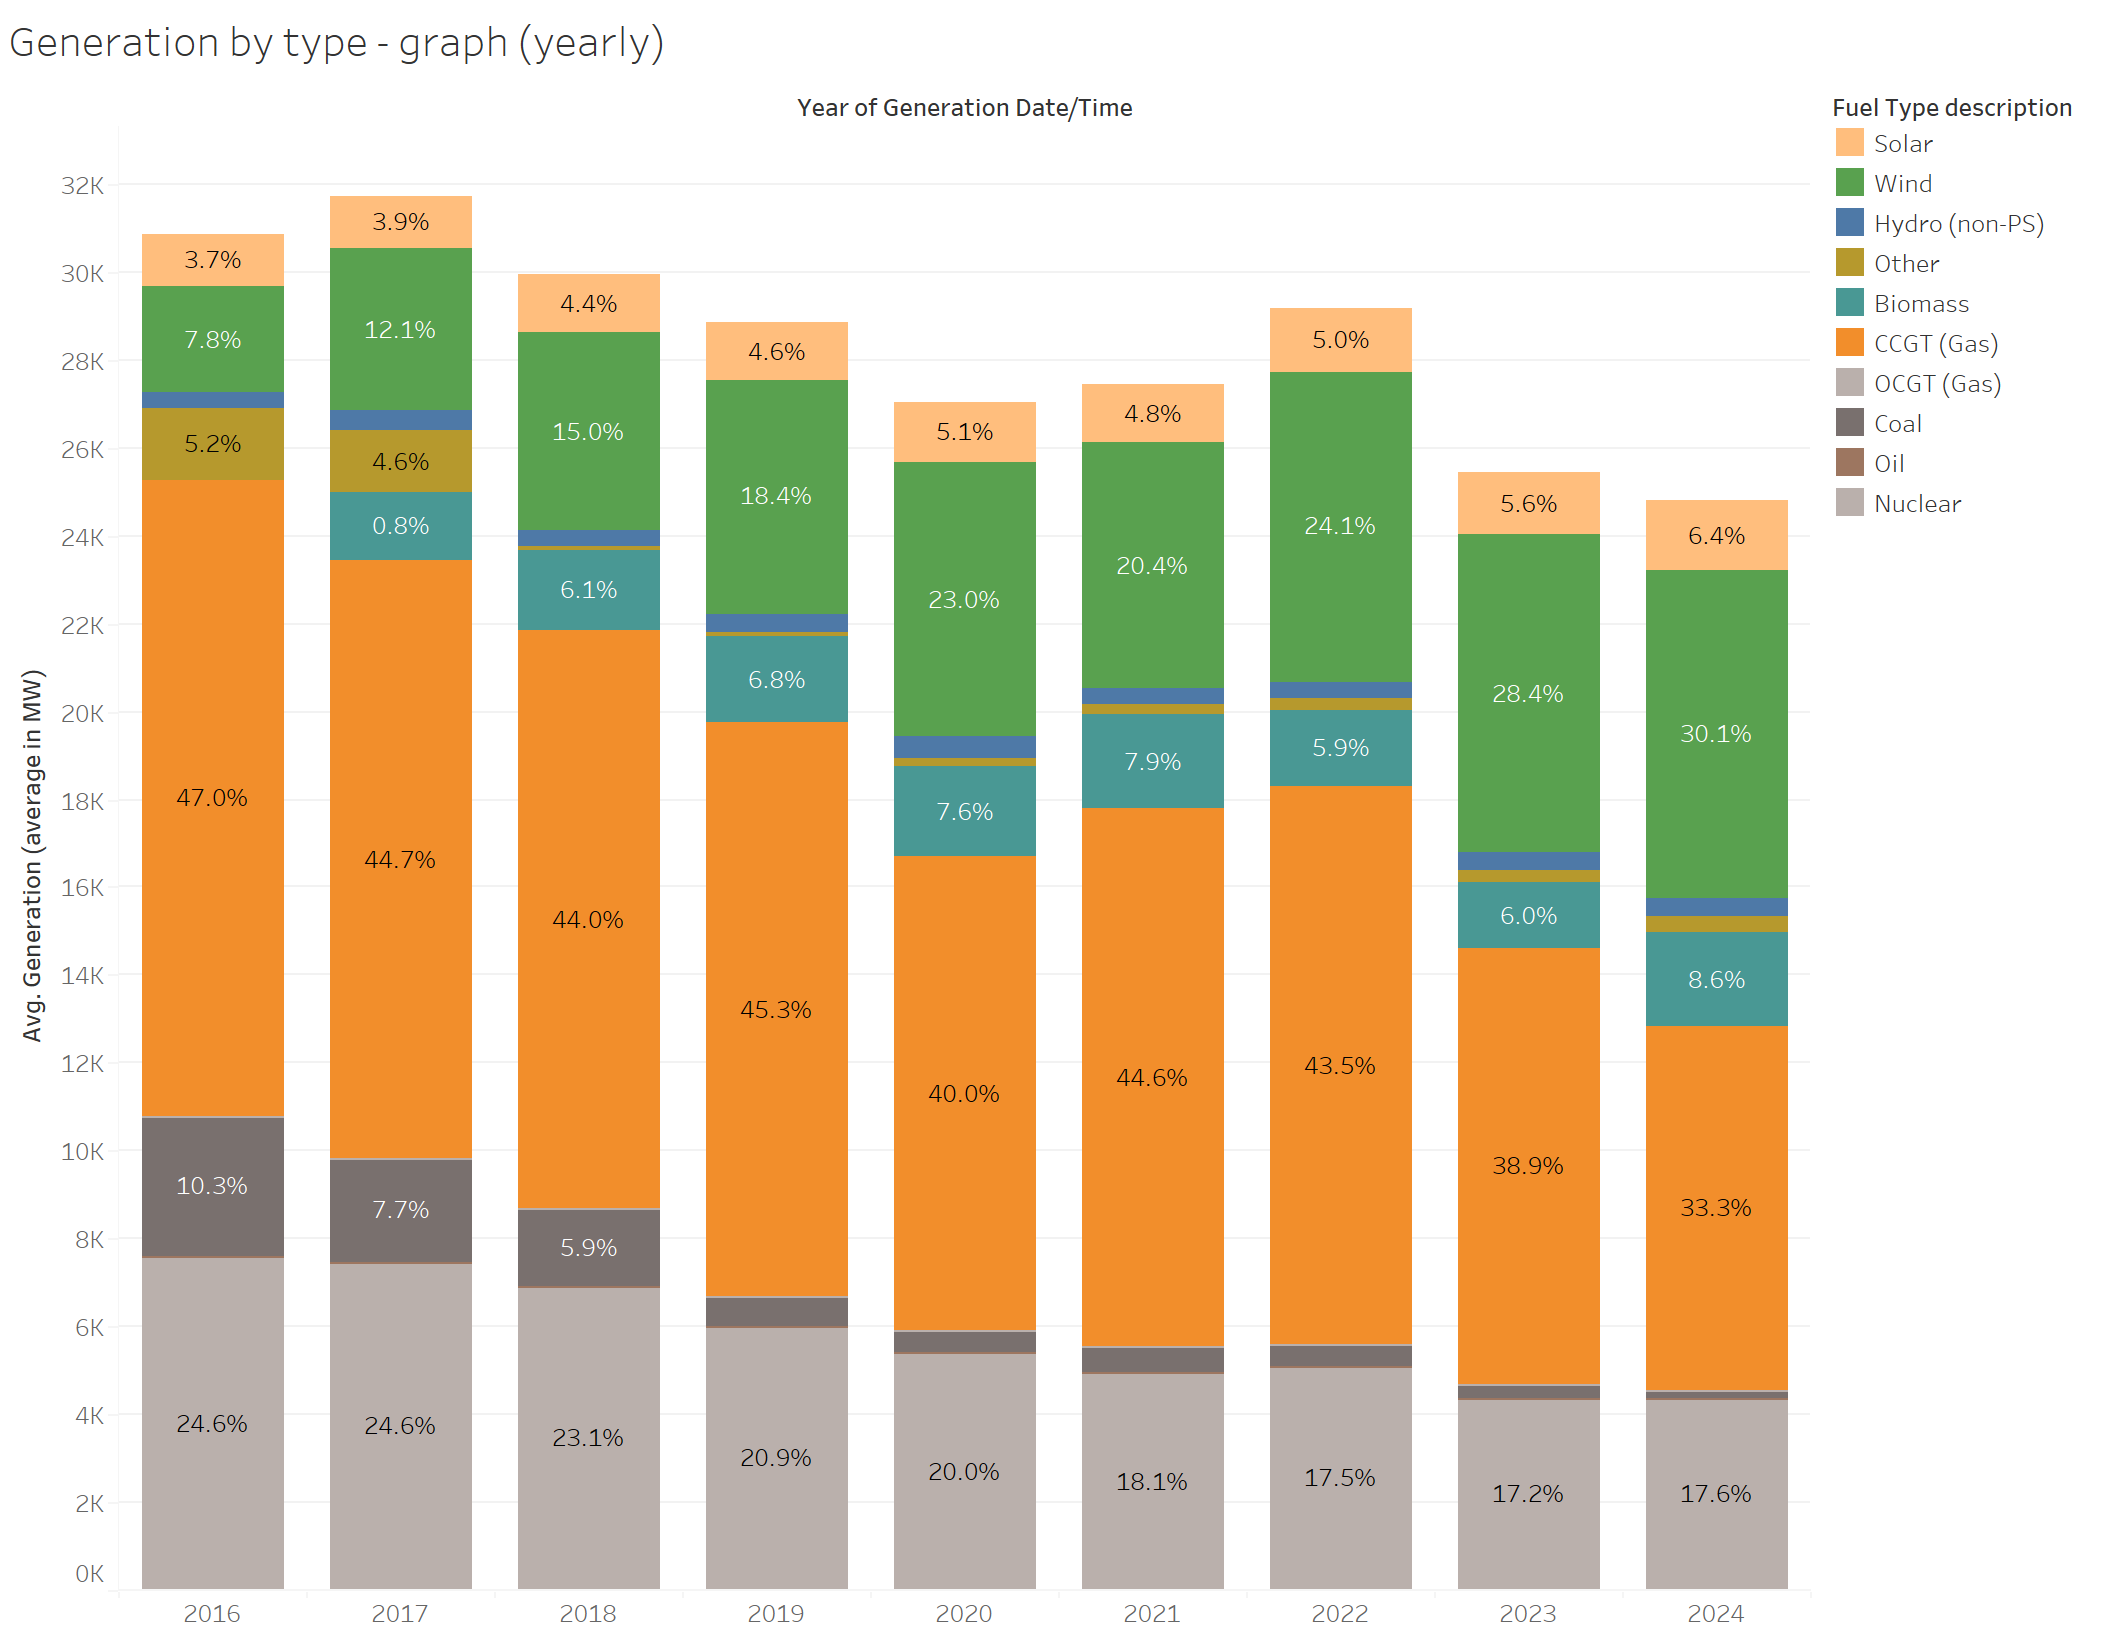
Gas remained Britain's main source of electricity generation - but less than wind & solar combined
Although generation from domestic gas turbine power stations dropped to 33.3% of domestic generation, it remained Britain's single largest source of electricity. However, the combined electricity from wind and solar reached 36.5% - exceeding gas for the first time.
GB total domestic generation, at 218TWh was the lowest in recent times.
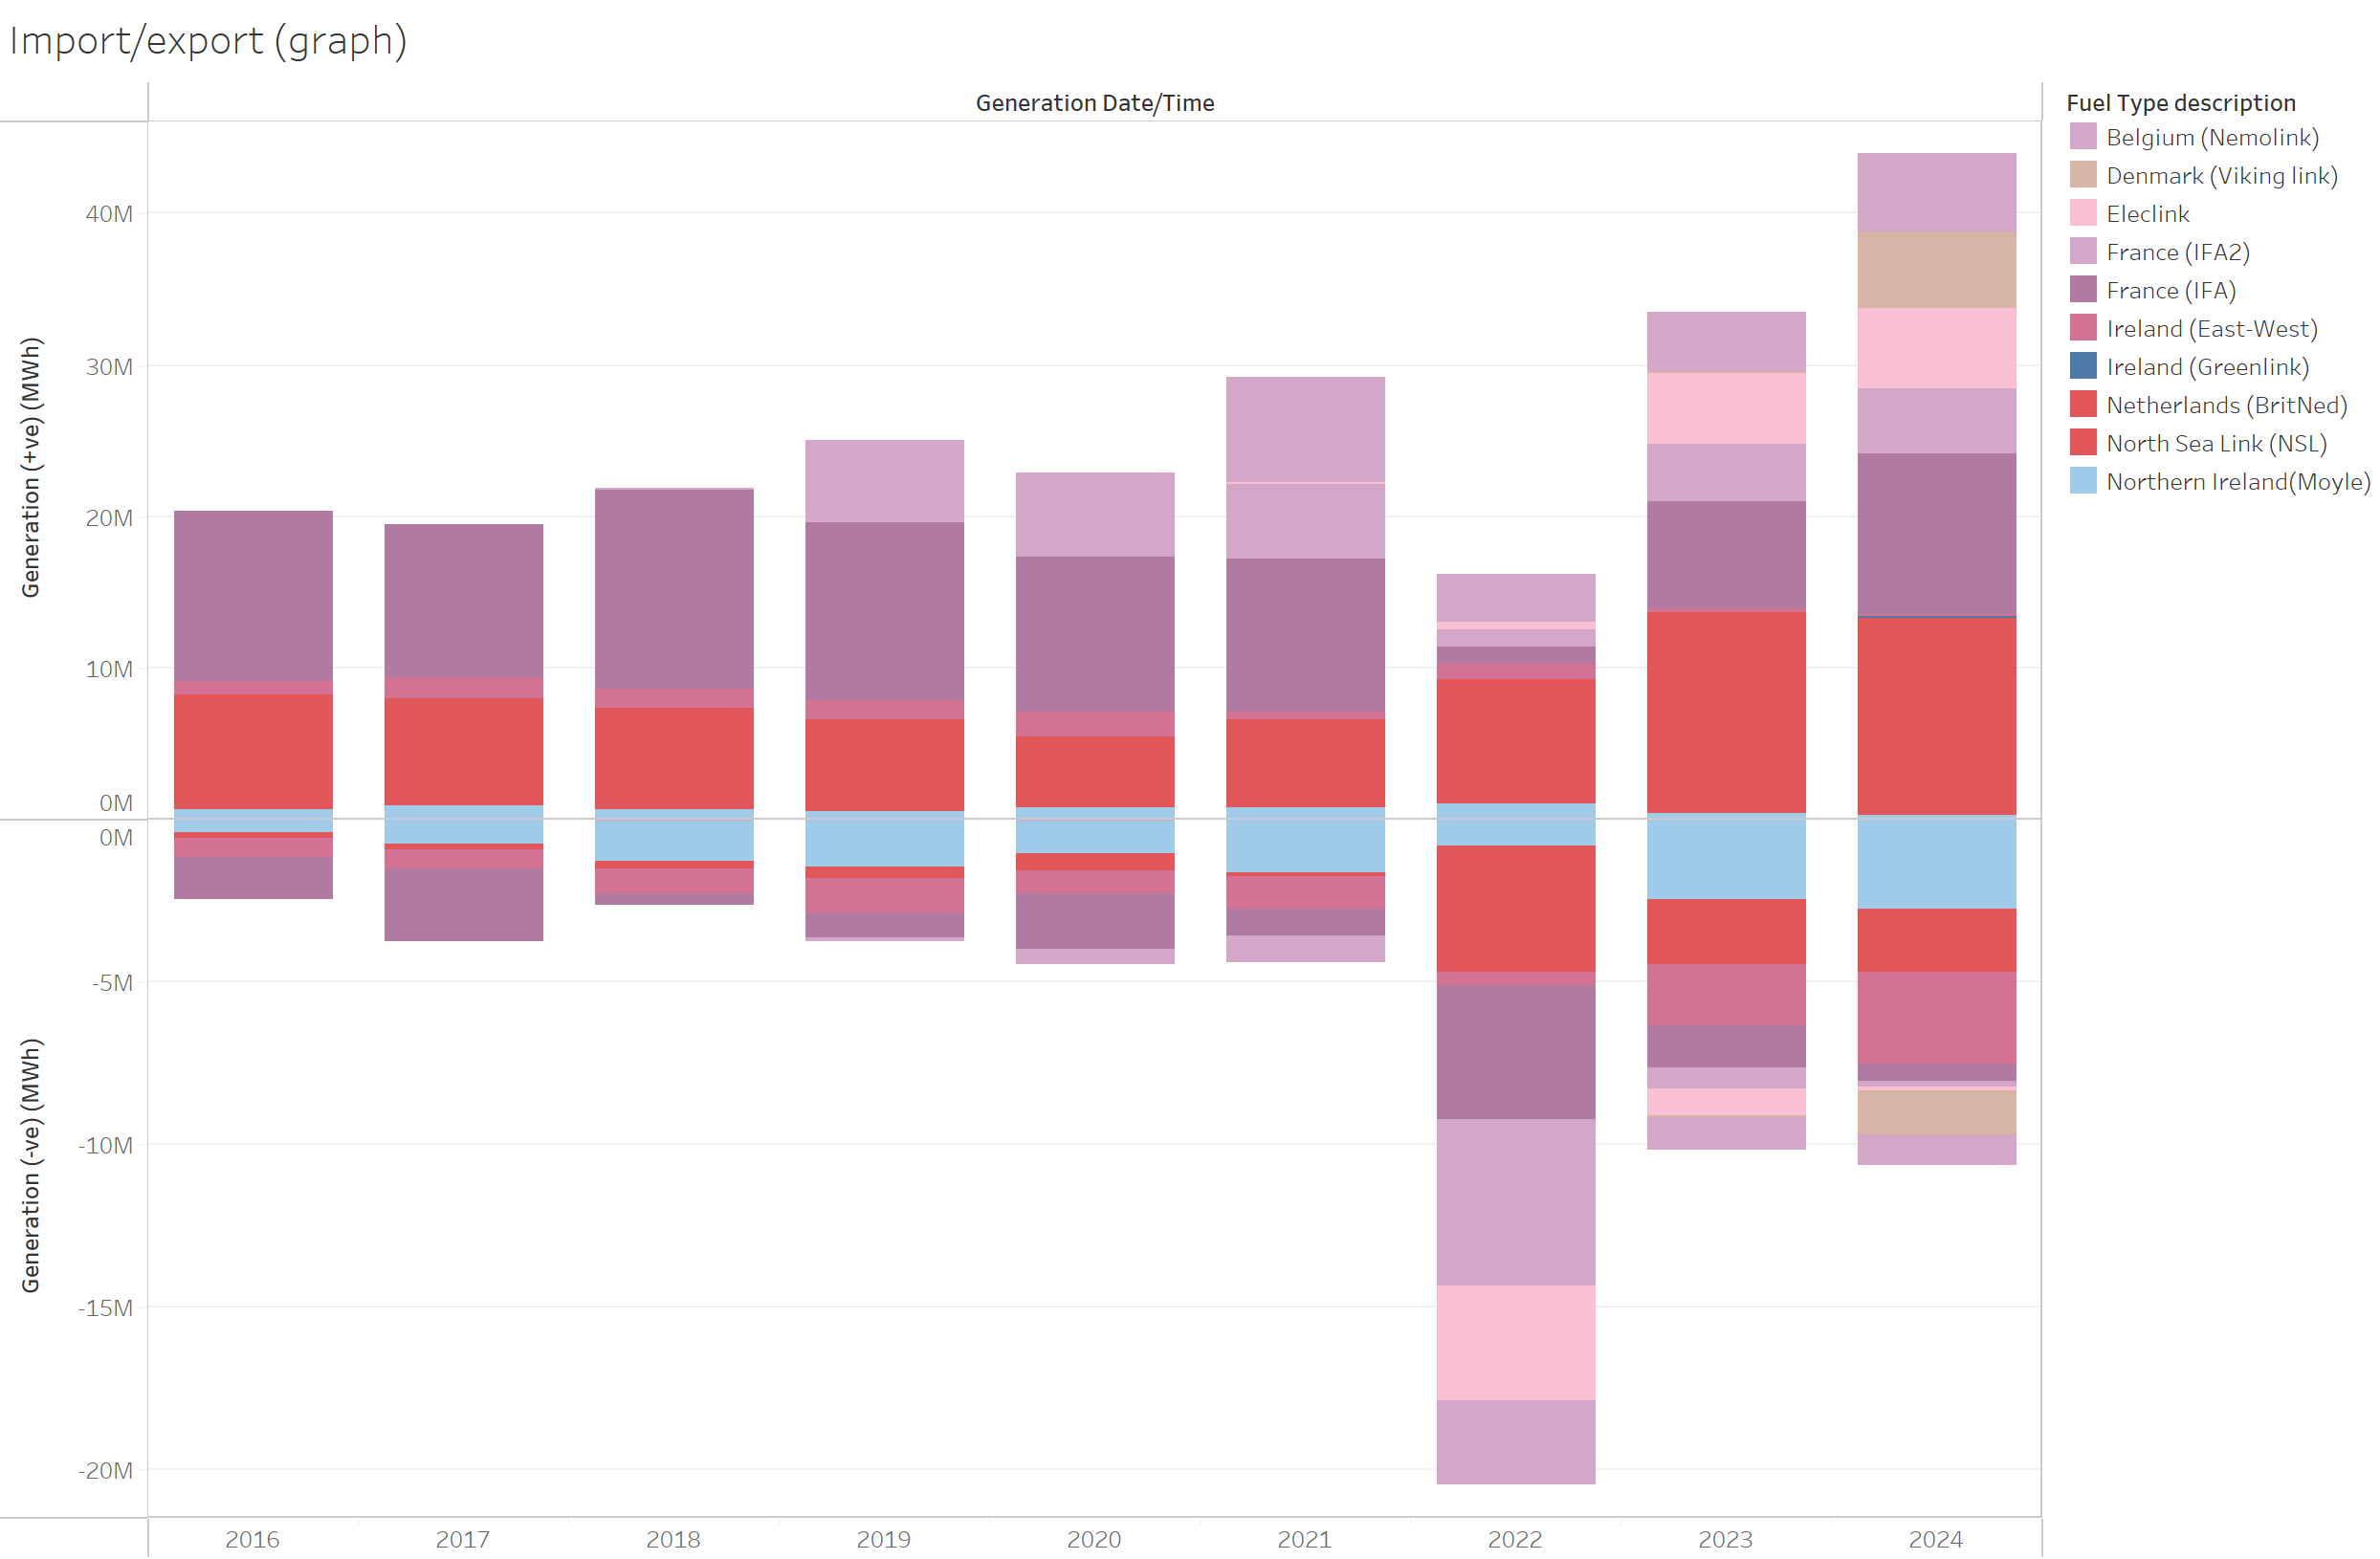
Interconnects imported more electricity than ever
GB imported nearly 44TWh during 2024, and exported 10.6TWh, (net 33.3TWh), helped by the new interconnect to Denmark.
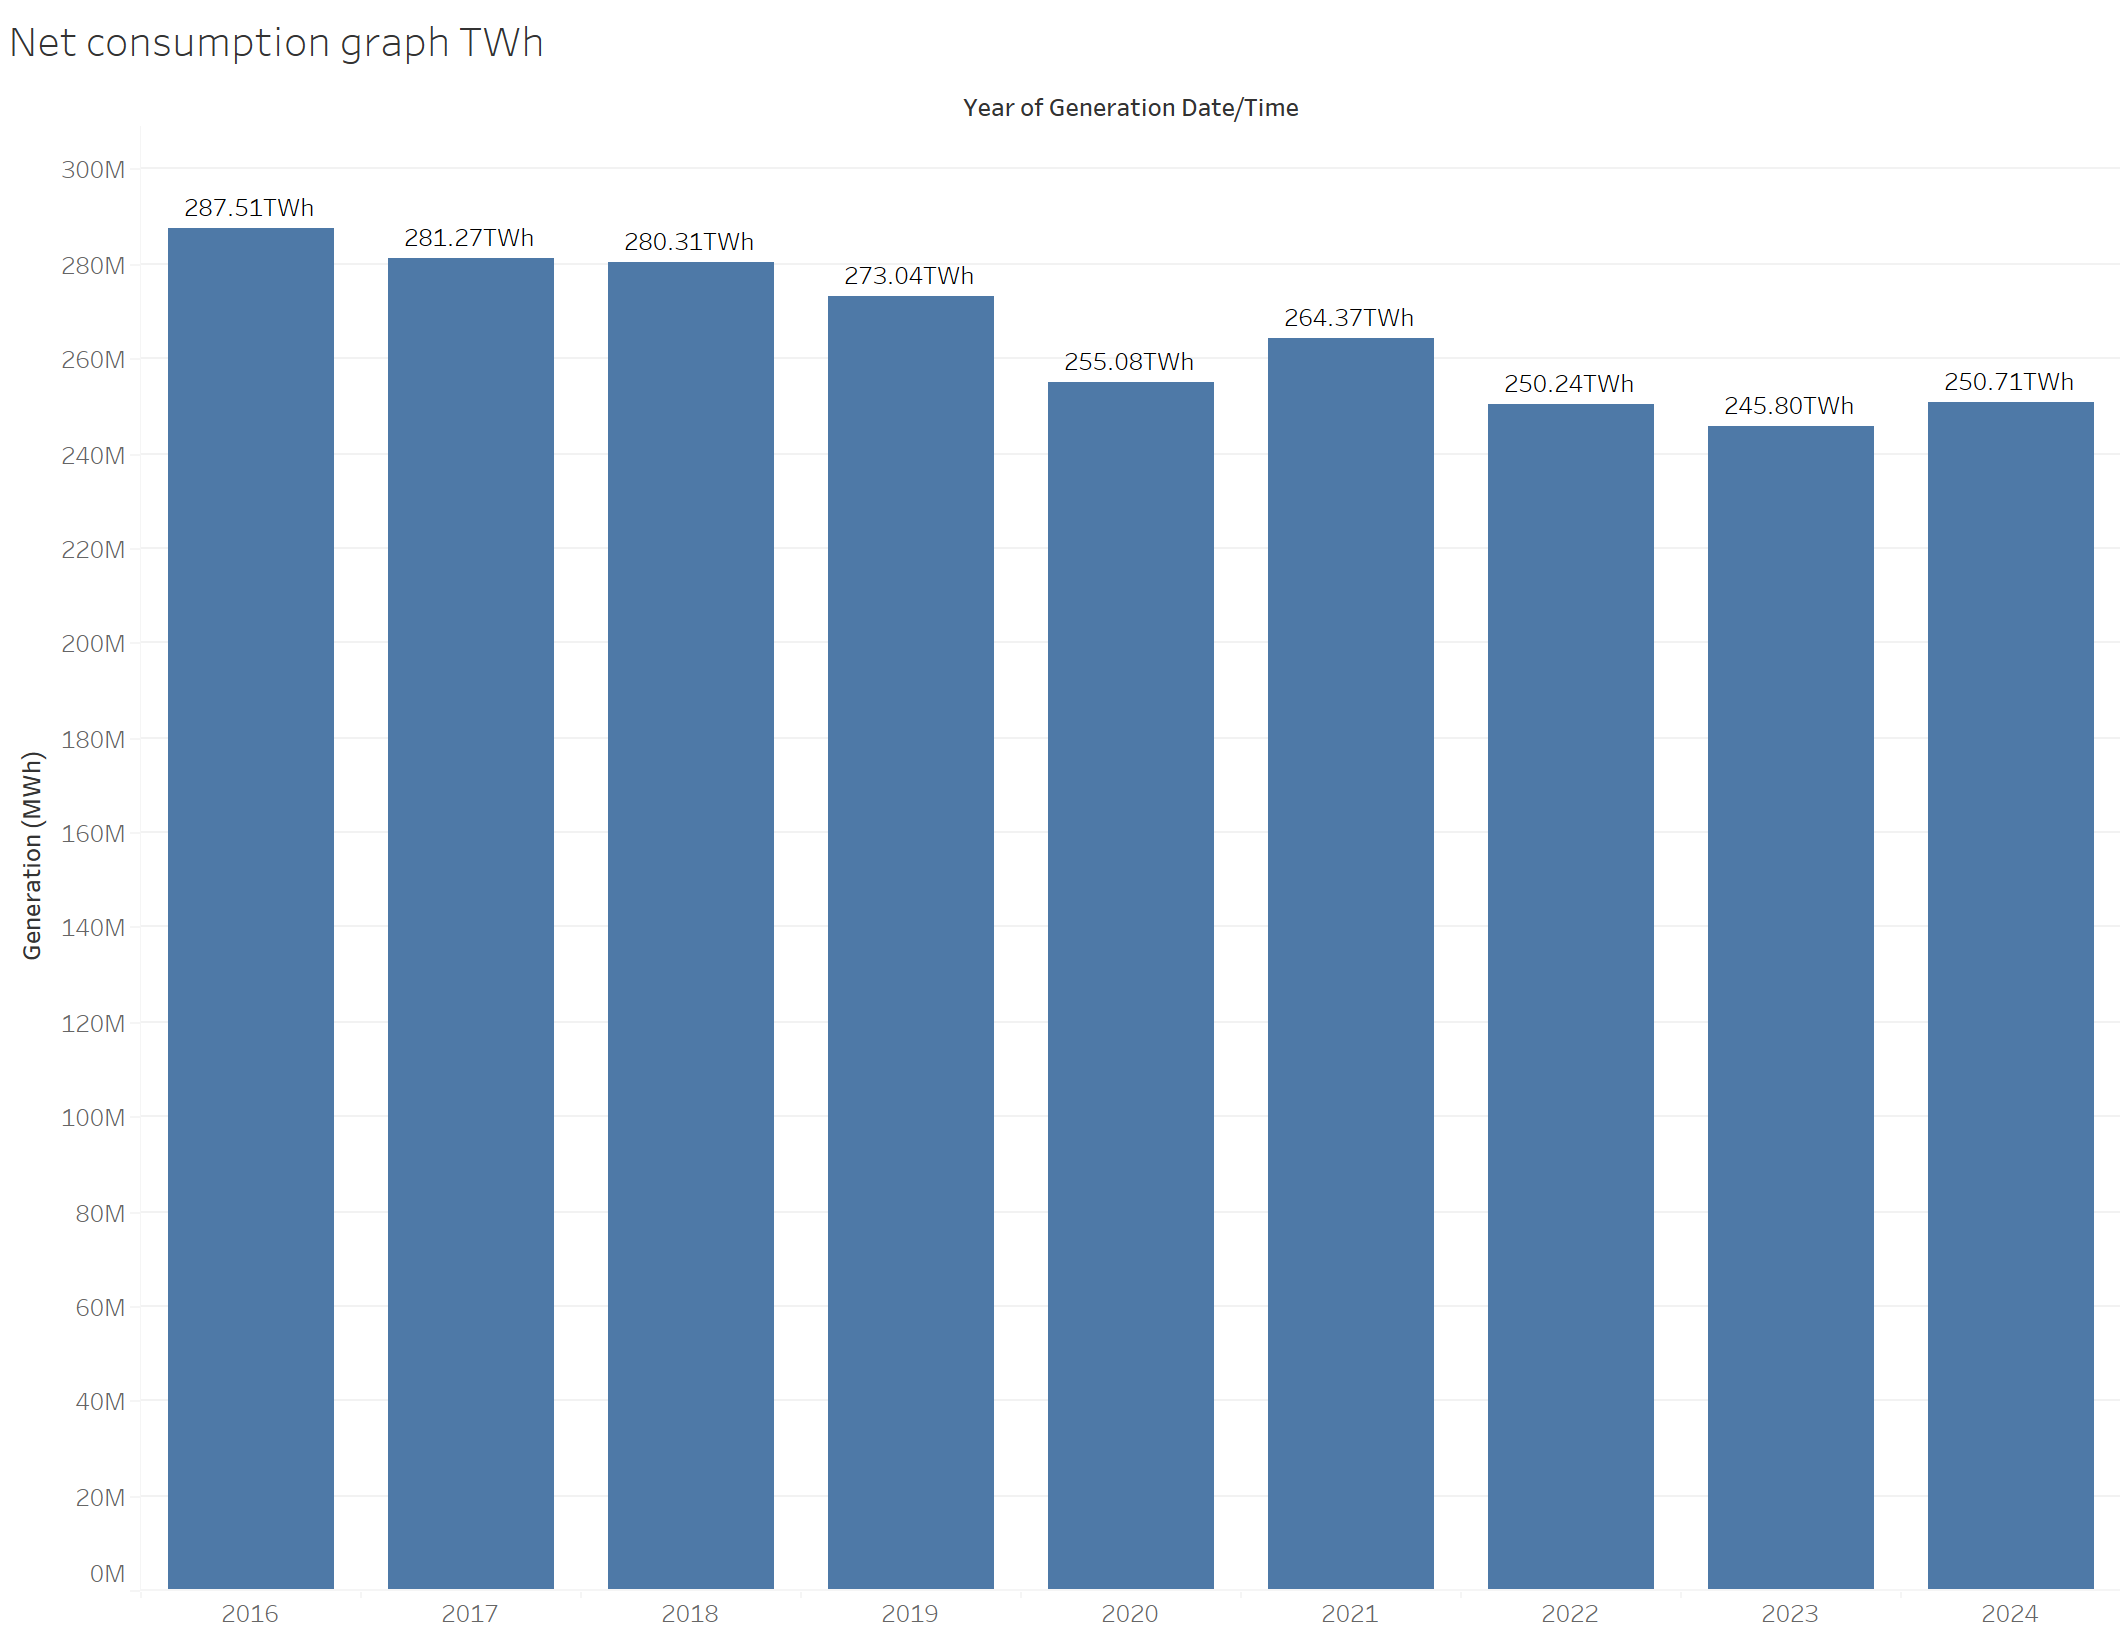
Combining the two, net consumption grew slightly from 246TWh to 251TWh, the highest since 2021:
New records
Several new records were set in the year:
- Peak solar: 12:00 on Sunday 2nd June saw solar generating 11.4GW, and across the whole day solar contributed 97.7GWh. (Compared to 23rd November, where solar generated just 1.3GWh)
- Lowest gas generation: 15:00 on 5th April saw gas generation drop below 1GW for the first time since it took over from coal as the main source of electricity. At 13:00 on 15th April, it dropped to 738MW.
- Not quite peak wind: The most generation from wind was 15th December at 18:00 with 17.1GW - but this didn't quite reach 2023's peak of 17.4GW. The windiest day was 22nd December 2024, contributing 385GWh, but this didn't quite reach the 396GWh from 20th December 2023.
Volatility
The variability of solar and wind generation can be seen across the year:
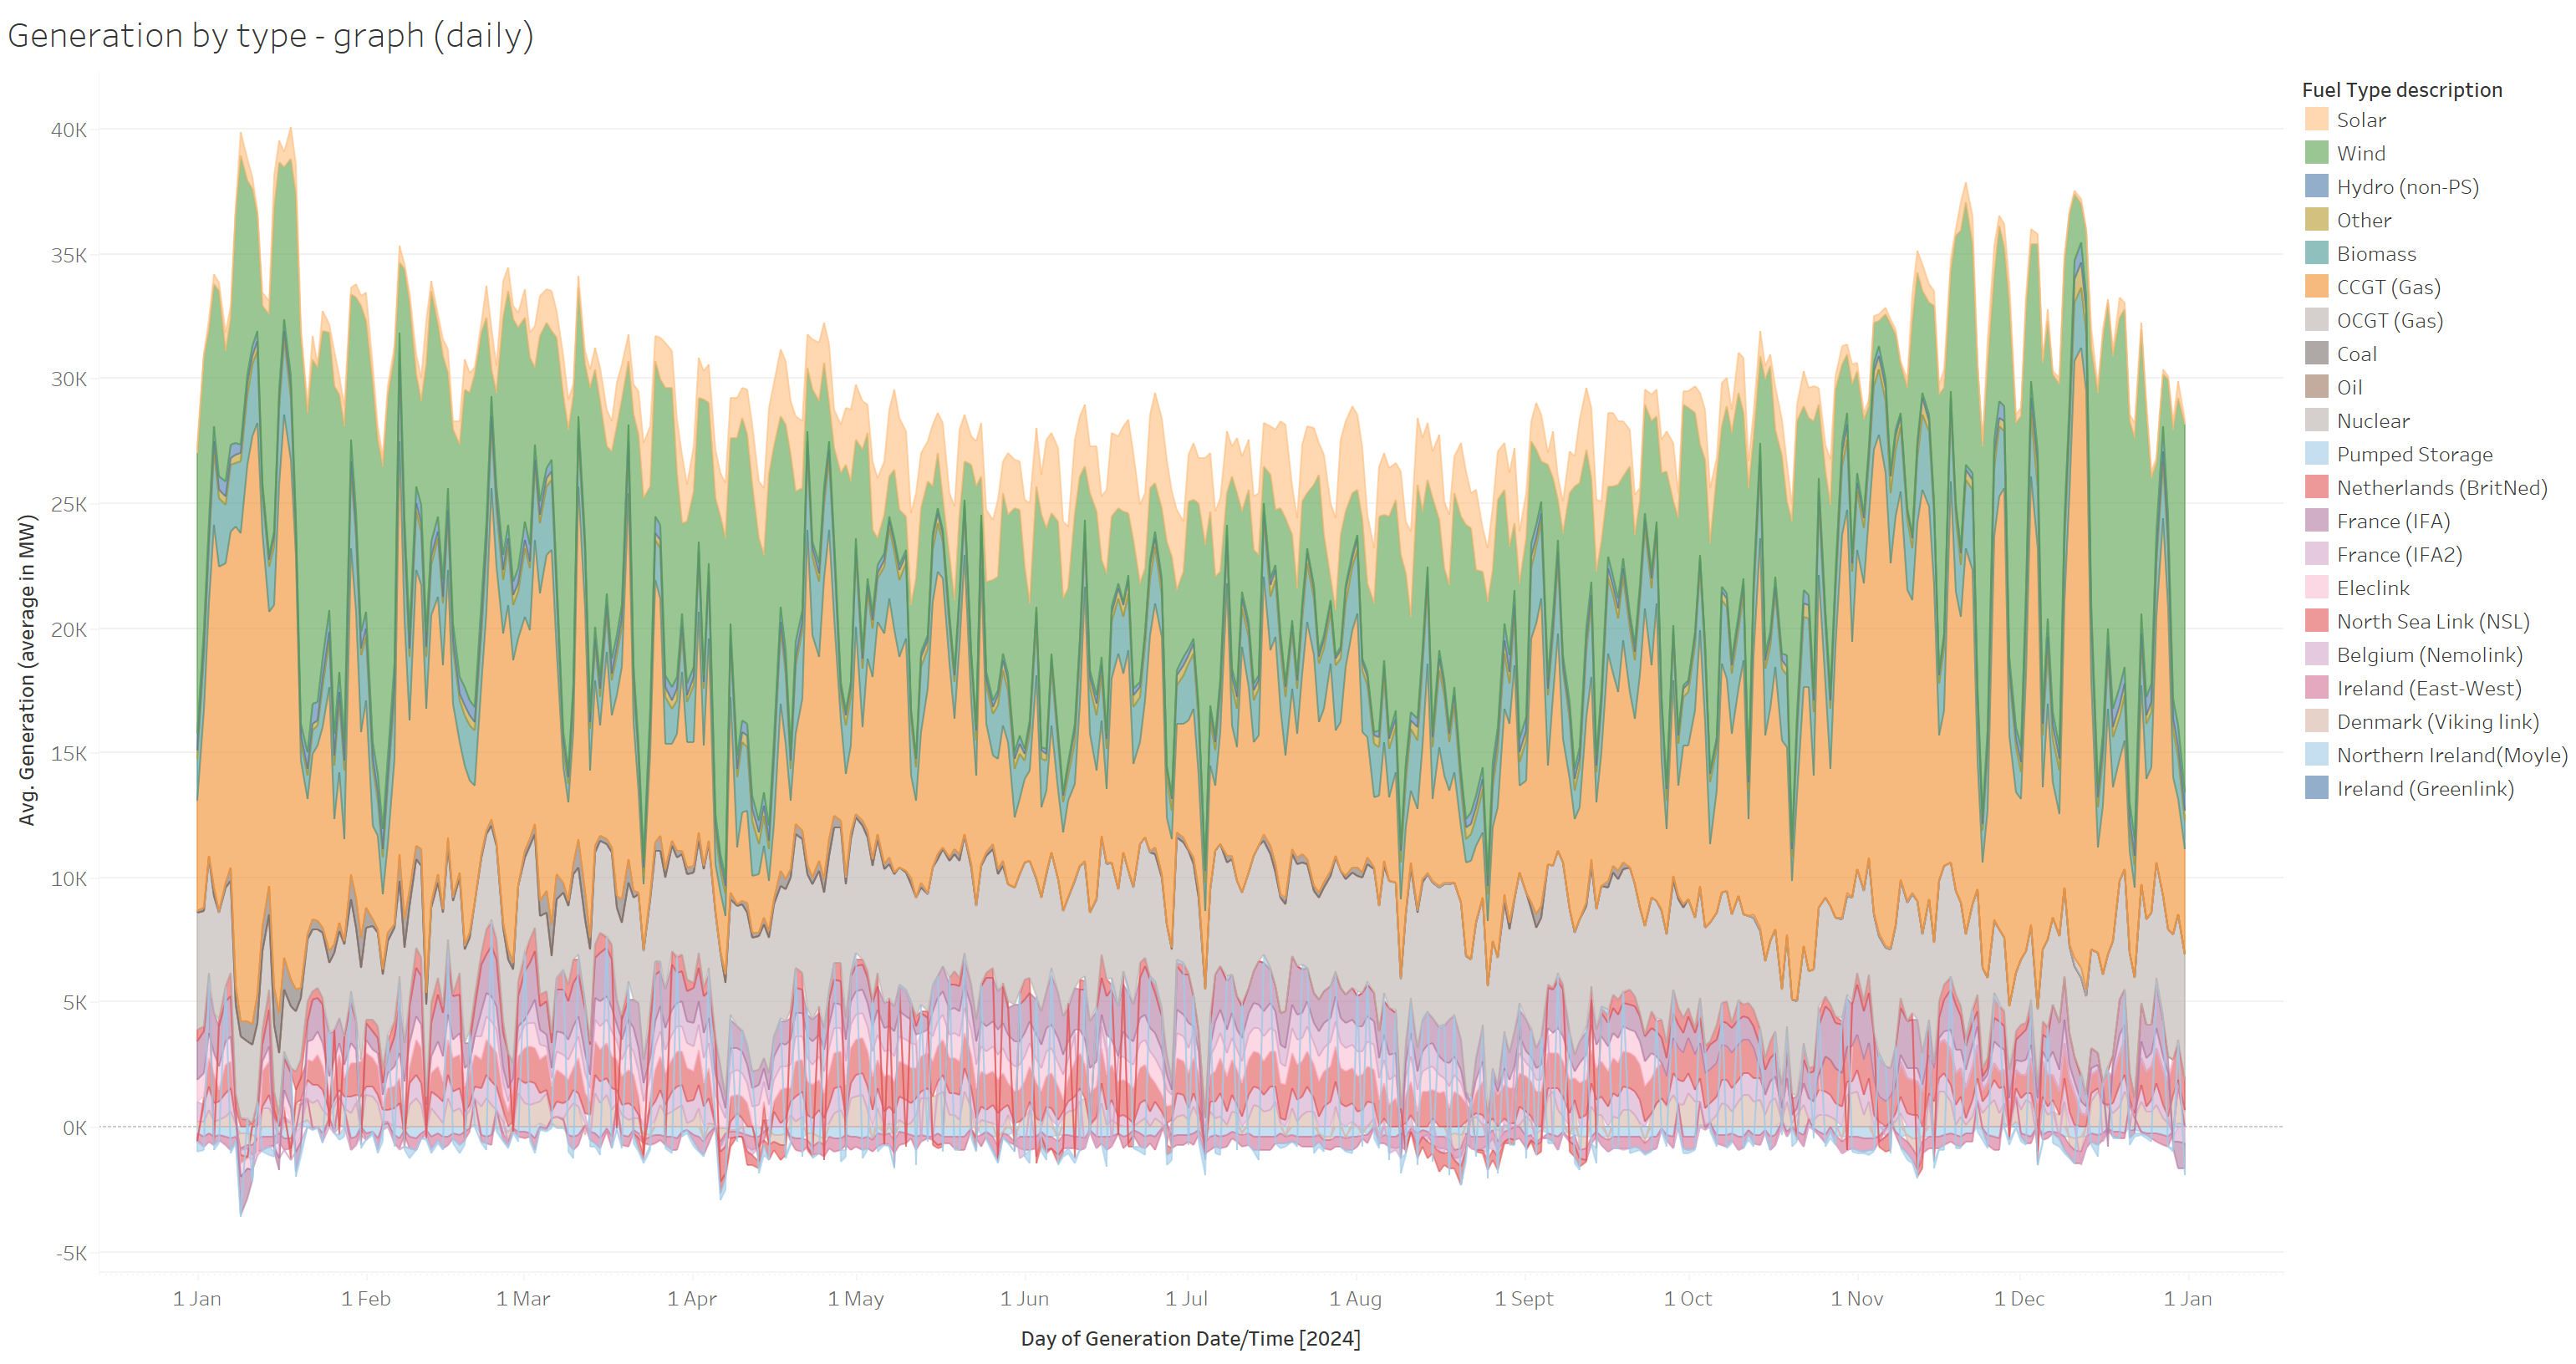
The peak day was 18th January, peaking at 46.1GW at 11:00 (929GWh over the entire day), and the lowest was 5th August where domestic consumption was just 505GWh. The lowest hourly consumption was 03:00 on 22nd August, where domestic consumption was just 15.8GW.
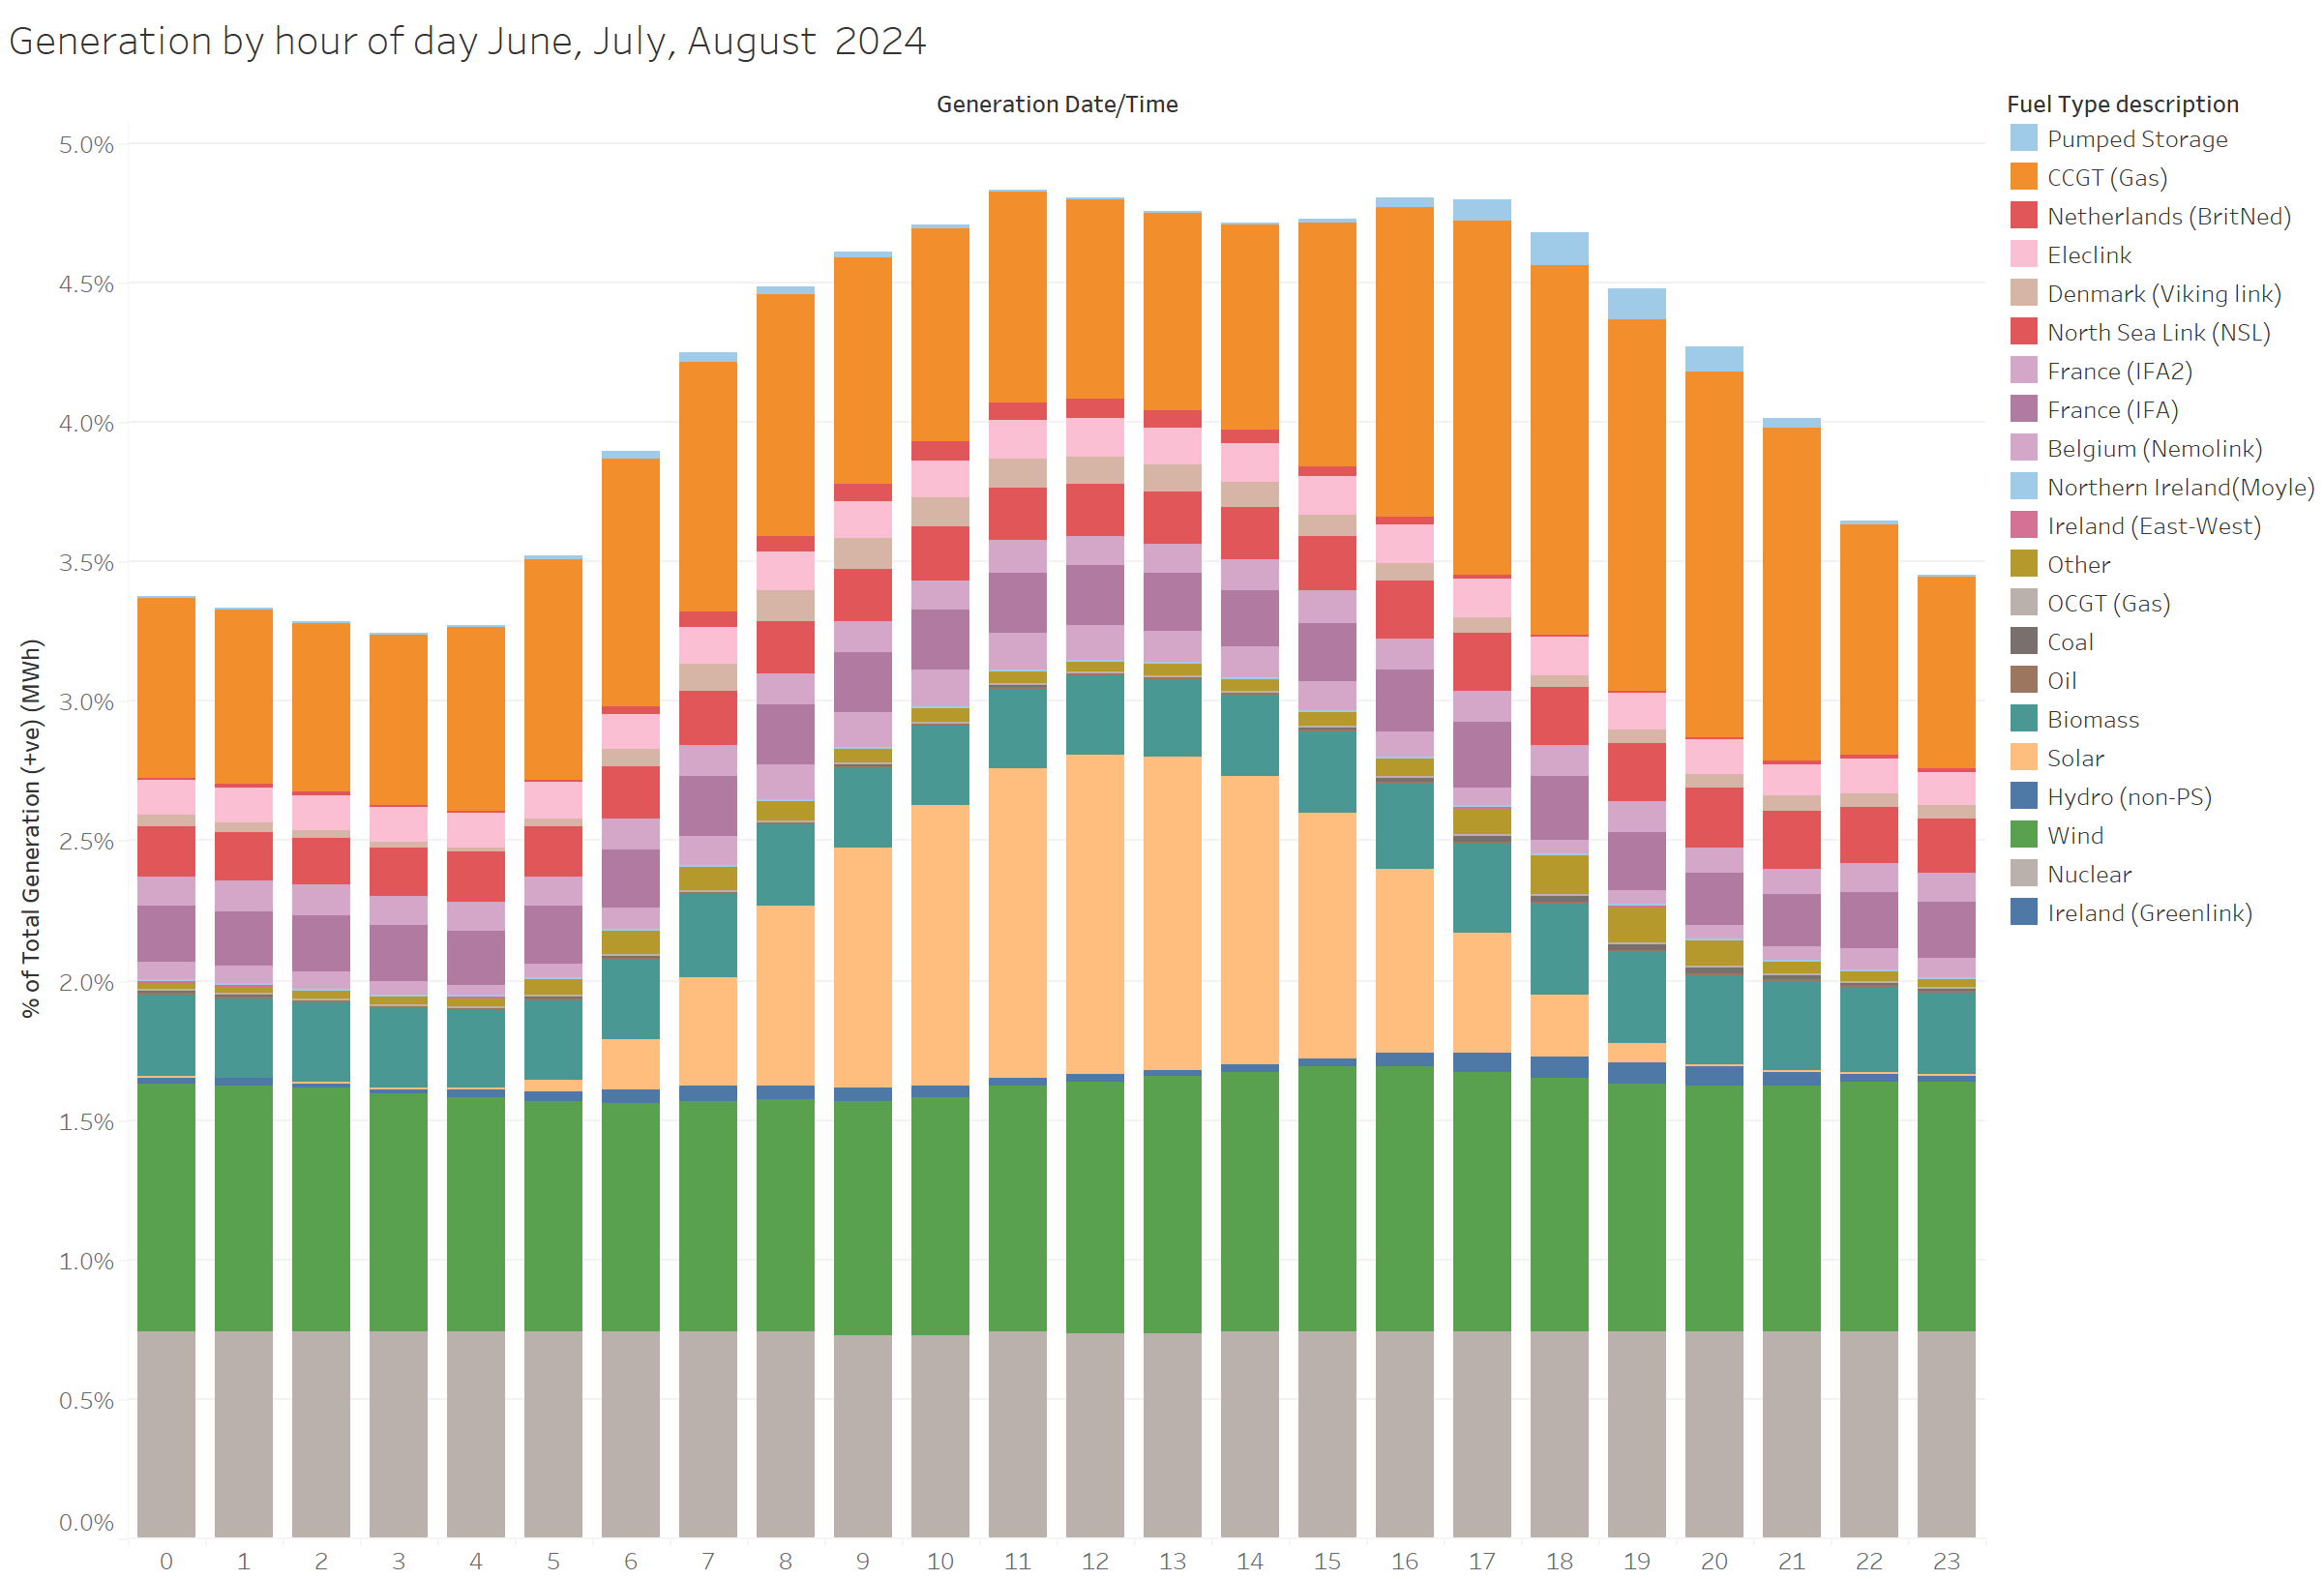
The impact of solar by hour of day in the summer months can be seen below:
More detail and data sources
This analysis is based on Elexon's "Generation by fuel type" data, at 30 minute resolution, supplemented by University of Sheffield's Solar PV generation estimates.
Note this is GB data, and will therefore vary from UK data reported elsewhere.
Note that due to interconnects and storage, consumption and generation are not equal.
You can explore the data further in Tableau here: